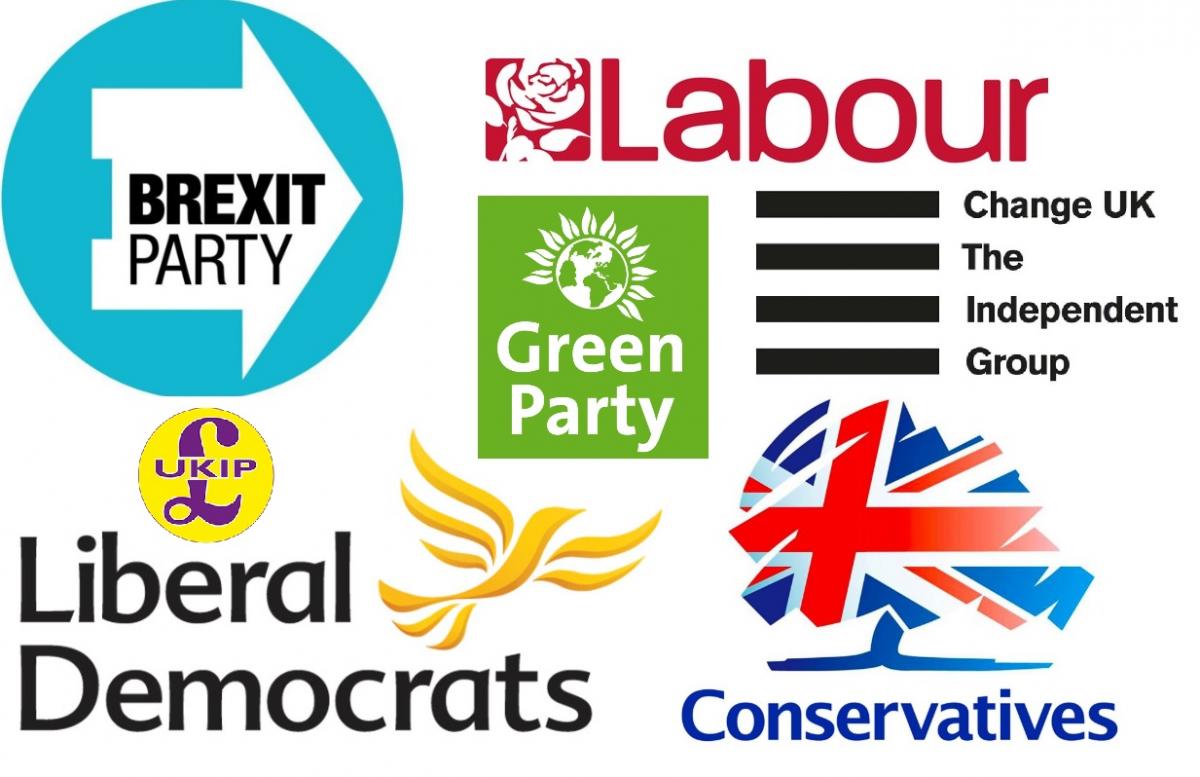
The European Parliament election results were announced over the bank holiday weekend after voters from across Europe casting their ballot last week.
In the UK, the results did not make for happy reading for the Conservative Party and the Labour Party, with the Brexit Party, the Liberal Democrats and the Green Party all enjoying sizeable gains.
How did people vote in the your area? Here is the breakdown of votes in the Wycombe, South Bucks and Chiltern districts.
Wycombe district
• Change UK – The Independent Group: 2,261
• Conservatives: 6,021
• Green Party: 6,617
• Labour: 4,893
• Liberal Democrats: 13,333
• The Brexit Party: 15,652
• The Socialist Party of Great Britain: 51
• UK European Union Party (UKEUP): 140
• UK Independence Party (UKIP): 942
• McMahon, Jason Guy Spencer: 77
• Round, David Victor: 54
• Turberville, Michael Jeffrey: 37
The voting turnout was 39.96 percent.

South Bucks district
• Change UK – The Independent Group: 1,165
• Conservatives: 3,169
• Green Party: 2,163
• Labour: 1,200
• Liberal Democrats: 5,340
• The Brexit Party: 7,310
• The Socialist Party of Great Britain: 15
• UK European Union Party (UKEUP): 54
• UK Independence Party (UKIP): 372
• McMahon, Jason Guy Spencer: 45
• Round, David Victor: 25
• Turberville, Michael Jeffrey: 27
The voting turnout was 40.4 percent.
Chiltern district
• Change UK – The Independent Group: 1,881
• Conservatives: 4,381
• Green Party: 4,597
• Labour: 1,496
• Liberal Democrats: 10,942
• The Brexit Party: 10,319
• The Socialist Party of Great Britain: 41
• UK European Union Party (UKEUP): 88
• UK Independence Party (UKIP): 496
• McMahon, Jason Guy Spencer: 42
• Round, David Victor: 37
• Turberville, Michael Jeffrey: 33
The voting turnout was 48.2 percent.


Comments: Our rules
We want our comments to be a lively and valuable part of our community - a place where readers can debate and engage with the most important local issues. The ability to comment on our stories is a privilege, not a right, however, and that privilege may be withdrawn if it is abused or misused.
Please report any comments that break our rules.
Read the rules hereLast Updated:
Report this comment Cancel